Redefining the partner experience (PX)

An end-to-end inventory management app
$2.9M
yearly total savings
$2.1M
yearly licensing fees savings
15H+
hours freed for associates
$890K
hourly labor savings


scroll down
Redefining an associate experience that saved
$2.9 million annually
Petco’s redesigned physical inventory tool transformed a complex and time-consuming retail process into a streamlined, user-centric experience. Used across stores in the US, Mexico, and Puerto Rico, the tool empowers associates to efficiently scan and account for thousands of stock items during annual audits. By reducing friction, improving accuracy, and optimizing workflows, this initiative not only enhanced partner productivity but also generated $2.9 million in yearly savings.
Role
Sr. Product Designer
Industry
Retail
Length
9 months
Team

About this project
The company faced cost-cutting pressure during an economic downturn in 2024. The inventory process relied on a third-party B2B SaaS application that cost $2.1M annually and was used once a year per store. Leadership decided to replace it with an internal tool to reduce costs and gain operational control.
My role
Senior Product Designer (end-to-end ownership). I led discovery, research, system thinking, workshops, user flows, prototyping and visual design, working with PMs, engineers, stakeholders and two designers in a cross-functional team of 10+ people.

Some context
Business problem
Extremely high annual licensing cost for a low- frequency process
High adoption and strong qualitative feedback Reduced operational friction and manual labor
Business problem
Constraints & reality




The actual requirement for this was to build a dashboard based on a template and use that to build a new system so we could get rid of the third-party system. What you’re about to see is the process we followed and the decisions we took.
The process
01
Looking
02
Understanding
03
Making
The research


Two Product Designers were assigned to this initiative, and pushed to perform UX research to understand the background and properly strategize a system that would benefit both the business and the end users.
My role
Note taking, analysis, insight finding and mapping

The worst part about the process is essentially you have to do it twice, once on paper & then again entering it into the computer.
"
General Manager
"
I think 80% of the time we’re just hunting for stickers.
General manager
After running the research and creating our user persona, we discovered what the user goal was: Having a smooth inventory so they could go home as quick as possible.
Analysis
Once we heard how the process had been adapted by the general managers to happen in real time, we sat down and mapped the journey of the partner through it, and the blockers we encountered on each, shown by red warnings.

We set out to detangle the journey and make it more streamlined. Currently, the users start by enabling the categories they need in their specific Petco Store, being able to toggle on and off between more than 60 categories. Then, users place stickers through the store, and input the sticker ranges by scanning the first and last sticker of a range, and selecting the category for said range. This reduces the time spent from 8 to 16 hours to only 2 to 4 hours depending on the size of the store. Then, they can scan and audit as normal. When there are missing stickers, the user can now find out via the dashboard and assign a Missing sticker to a partner by clicking on the notification button.
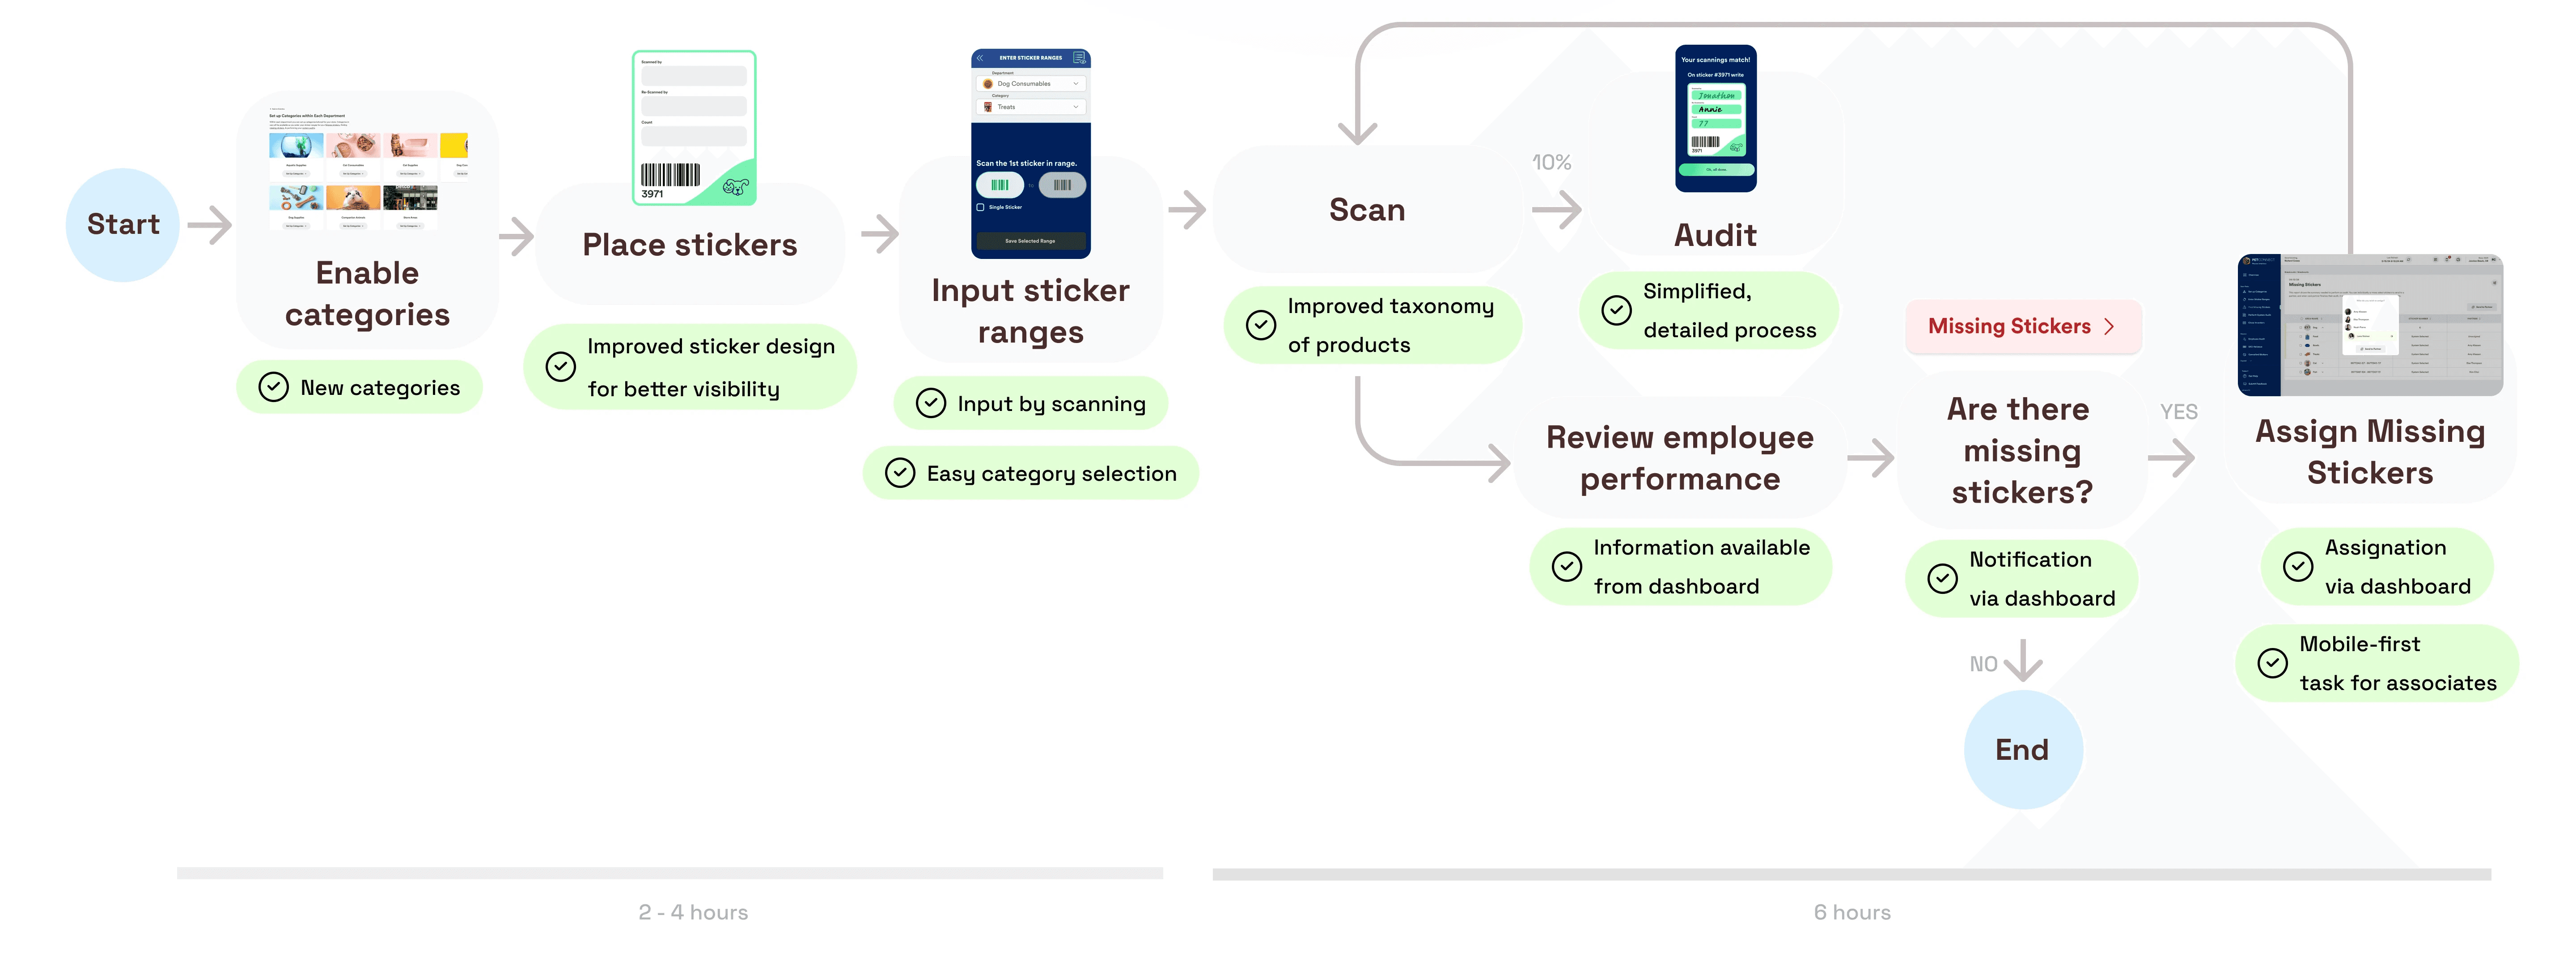

While product design worked on detangling the journey together, my main involvement was on what happens on the place stickers section, audit, review employee performance, and missing stickers
Three main tasks I improved
01
Stickers
02
Reports & Audits
03
Printing
To come up with with ideas that were technically feasible from the get-go, improve design-development translation, and reduce friction, I led team-wide, cross-functional brainstorming sessions for all flows.
Instead of replicating the legacy system, I intentionally redesigned the experience around real operational behavior. You can see a few design documents that resulted from a brainstorming session.

What I built
Physical stickers
Redesigned fixture stickers with a unique color, larger size, and a hanging format for better visibility, even for tired eyes.
Audits & Reports
We streamlined reports and fields based on research, prioritizing what general managers used and deemed important.
Printing
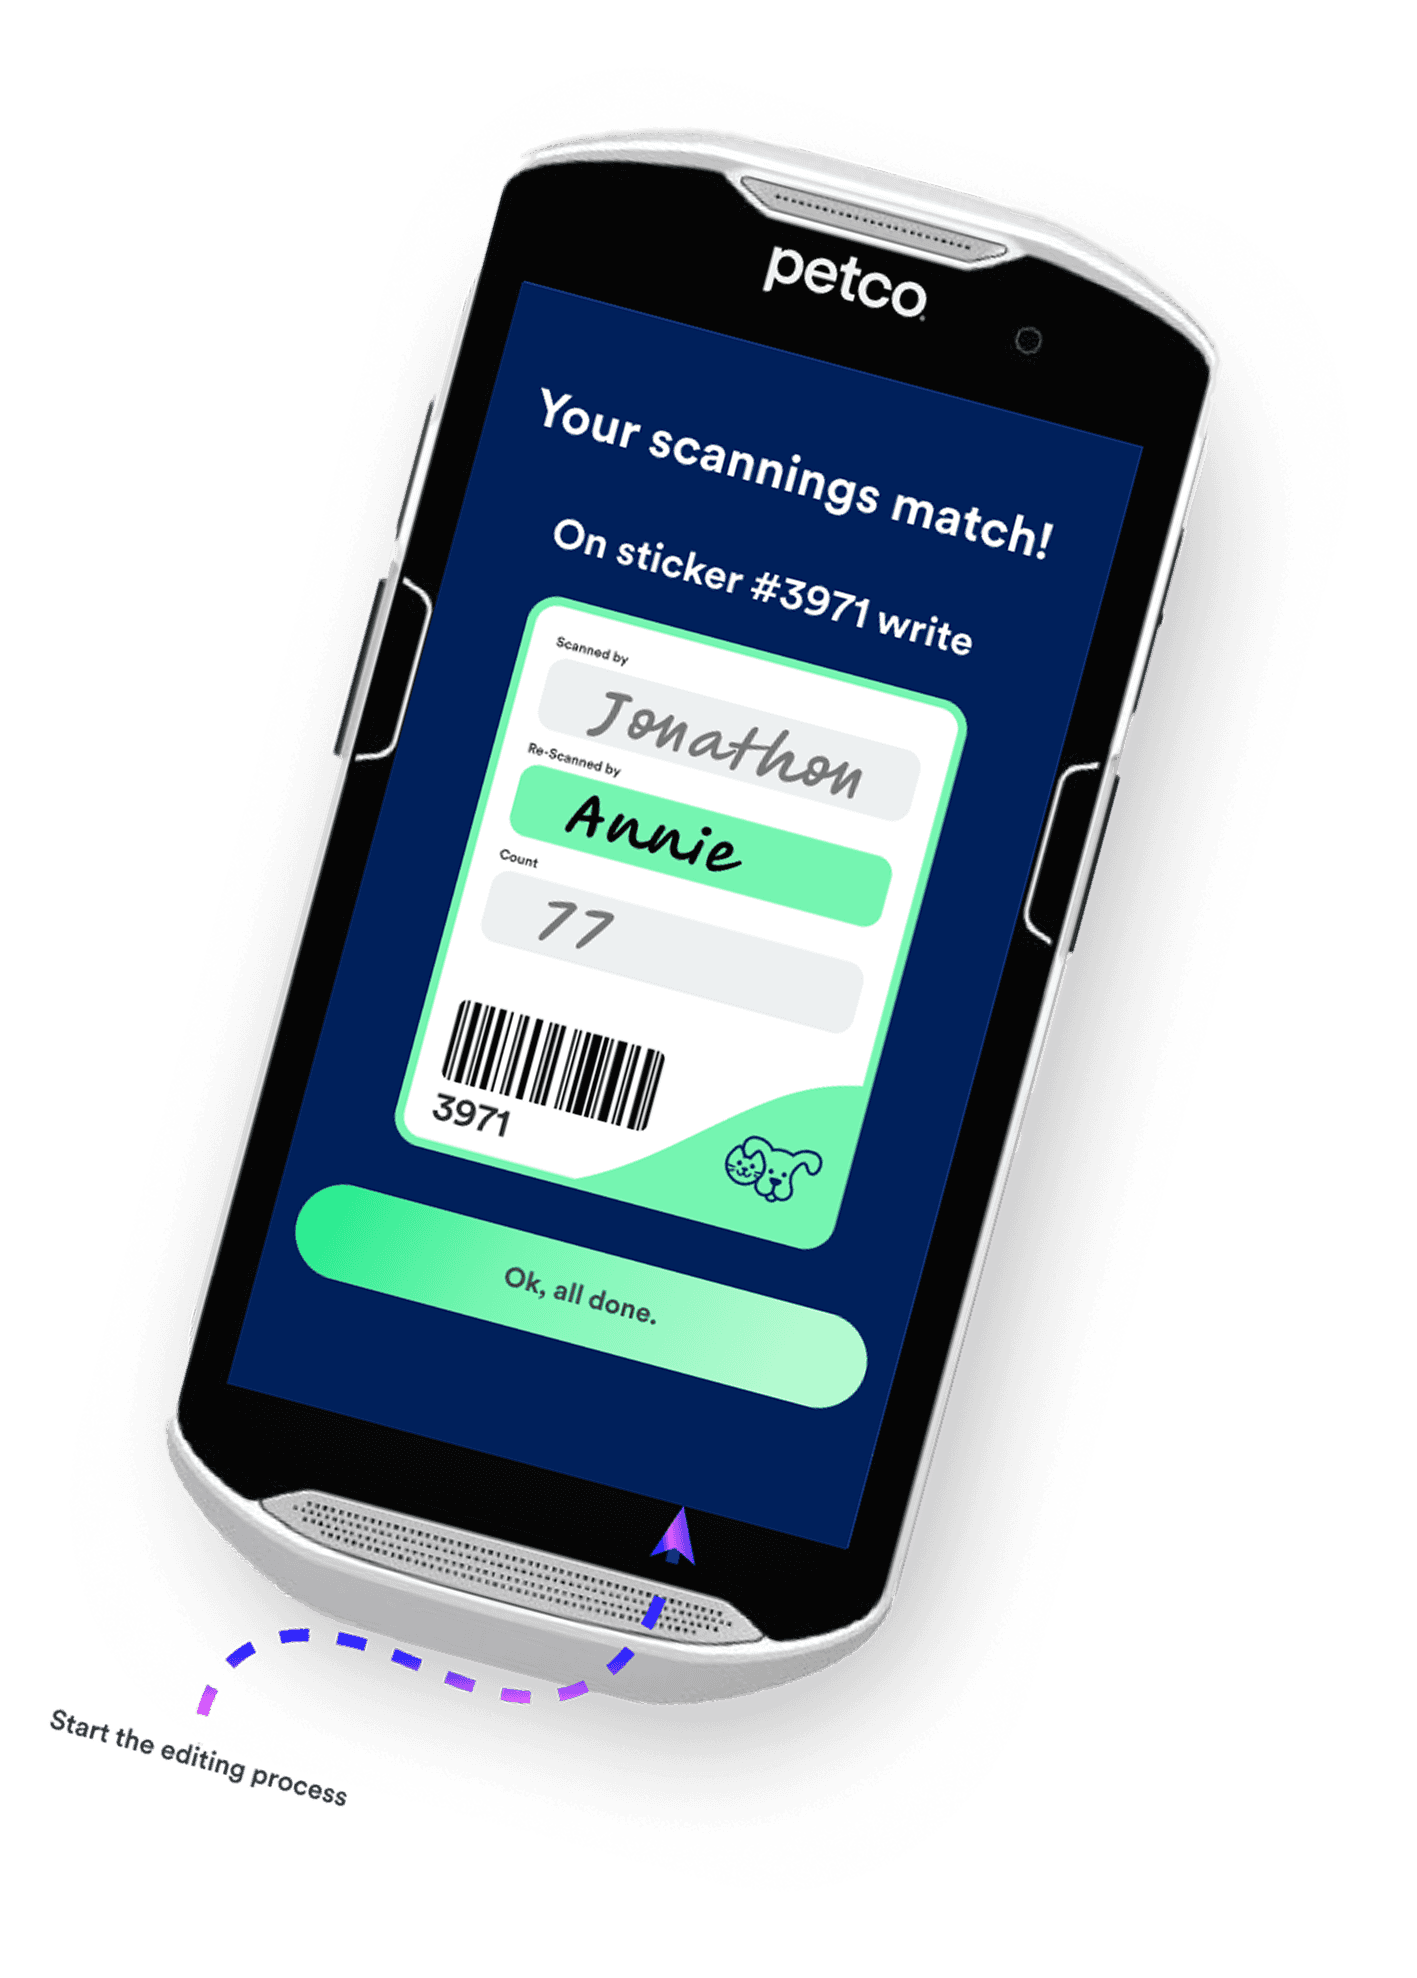
Designed a guided printing flow, helping users link printers, load the correct paper, and troubleshoot issues.



more clarity
3 labeled fields and no hyphen
error prevention
more space to write, guided by the app
What we didn't build

One of the initial solutions we thought of was to integrate the inventory system within the app associates already use for StoreOps.
We didn't go through this route because the cons outweighed the pros. Although unifying the platform could've created familiarity and the codebase was more cost-effective, we would have overloaded an already complex app with this new giant feature, and it's scalability would have been compromised. Also something very important to note is that there could be performance issues related to the size of both tools.
Set Sticker Ranges
Scan Stickers
Find Missing Stickers
Audit Stickers

Trade-offs & risks
What we gained
A system aligned with how partners actually work. High adoption and strong qualitative feedback Reduced operational friction and manual labor
what we paid
Approved time for research reduced our time and political strength to QA. • Time spent reconstructing legacy logic without official access • Multiple redesigns due to lack of early QA and real devices • Pushed boundaries around accessing documentation to enable meaningful research We consciously accepted legal and political risk to understand users deeply enough to design responsibly.


We ended up building a native system for both desktop and mobile devices that mimics the way associates work, giving them more freedom to customize their inventory and spend more time on the sales floor, so they can finish earlier and go home.
Impact
Adoption was extremely high, with partners consistently reporting that the system felt: Faster, clearer, more aligned with their real workflows.
$2.9M
yearly total savings
$2.1M
yearly licensing fees savings
15H+
hours freed for associates
$890K
hourly labor savings

0000


I really like how easy it is to see the new stickers. Using the handheld to enter sticker ranges made it so much faster! I finished entering sticker ranges in half of my usual time.
"
General Manager
"
The new system saved us a lot of time and frustration during inventory. Having so many more categories made everything more organized, and the new handhelds are way better!
General manager